

AI Usage is the credit ledger in Data Dashboard: open it to see how many credits remain, how many were consumed each month, and to drill down to each user. There is nothing to configure here — the page is for review and reconciliation only, and the entry is shown to department admins only.

When you’ll need this

  • Month-end or month-start reconciliation: check the credit consumption of a calendar month.
  • Watch your credits: see how many credits remain and whether an overage needs to be handled in advance.
  • Trace consumption: when a month’s usage is high, expand it to see whether Knowledge generation, Message processing, or Reply generation consumed the most.
  • See the distribution across members: view usage details by user to learn who is using credits and where they go.

How to get there

Left menu → Data Dashboard → AI Usage. Once you are in, the top bar shows the breadcrumb Data Dashboard → AI Usage. The page has two sections: Credit Overview and Monthly Usage.
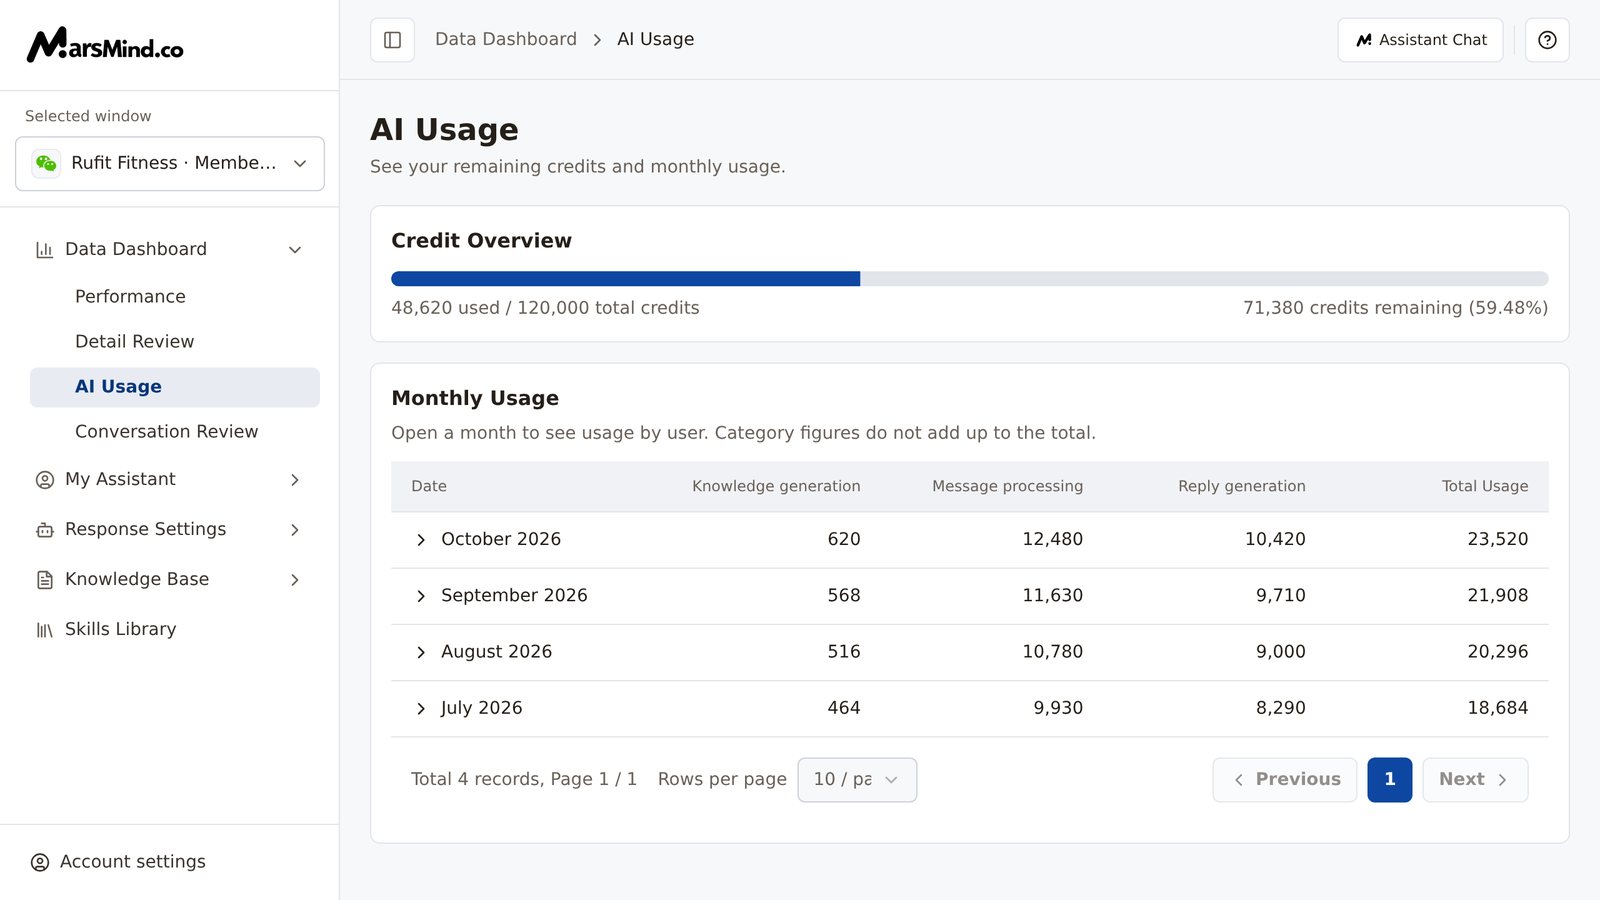
Full AI Usage page: the Credit Overview card at the top with a progress bar, used and total credits, remaining credits, and a percentage; below it, the Monthly Usage table with columns Date, Knowledge generation, Message processing, Reply generation, and Total Usage
If you cannot see the entry, the account is usually not a department admin — see Important notes below.

Steps

1

Check Credit Overview to confirm how many credits remain

The top card on the page is Credit Overview:
  • The progress bar shows the share of credits already used.
  • Below the bar, the left and right ends of the same row show “X used / Y total credits” and “Z credits remaining (P%)” (on narrow screens they wrap onto two lines).
How to tell it worked: all of these values are readable, and no “Load failed” message appears at the top of the page.If used credits exceed the total, the card title changes to “Usage · Over limit” and an extra row appears for Extra Usage (“N Credits”), where N is the amount over the total.
2

Find the month you need to reconcile in Monthly Usage

Monthly Usage shows one month per row, with the columns Date, Knowledge generation, Message processing, Reply generation, and Total Usage; the most recent month is at the top.To page through the table, use Previous and Next at the bottom; the footer also shows “Total X records, Page Y / Z”. To see more months at once, set Rows per page to “20 / page” or “50 / page”.How to tell it worked: you can find the row for the target month and all four number columns display correctly.Note: the card description reads “Open a month to see usage by user. Category figures do not add up to the total.” For reconciliation, quote the Total Usage column — do not add the three categories together.
3

Expand a month to see details by user

Click the month in the Date column (it has an arrow in front); the usage rows for each user expand below that month, with the same columns as above. Click again to collapse.How to tell it worked: user names and four figures appear after expanding; while loading, the row shows “Loading…”.Note: if expanding fails, the row shows “Load failed” and “Retry”; when the month has no details, it shows “No user details”.
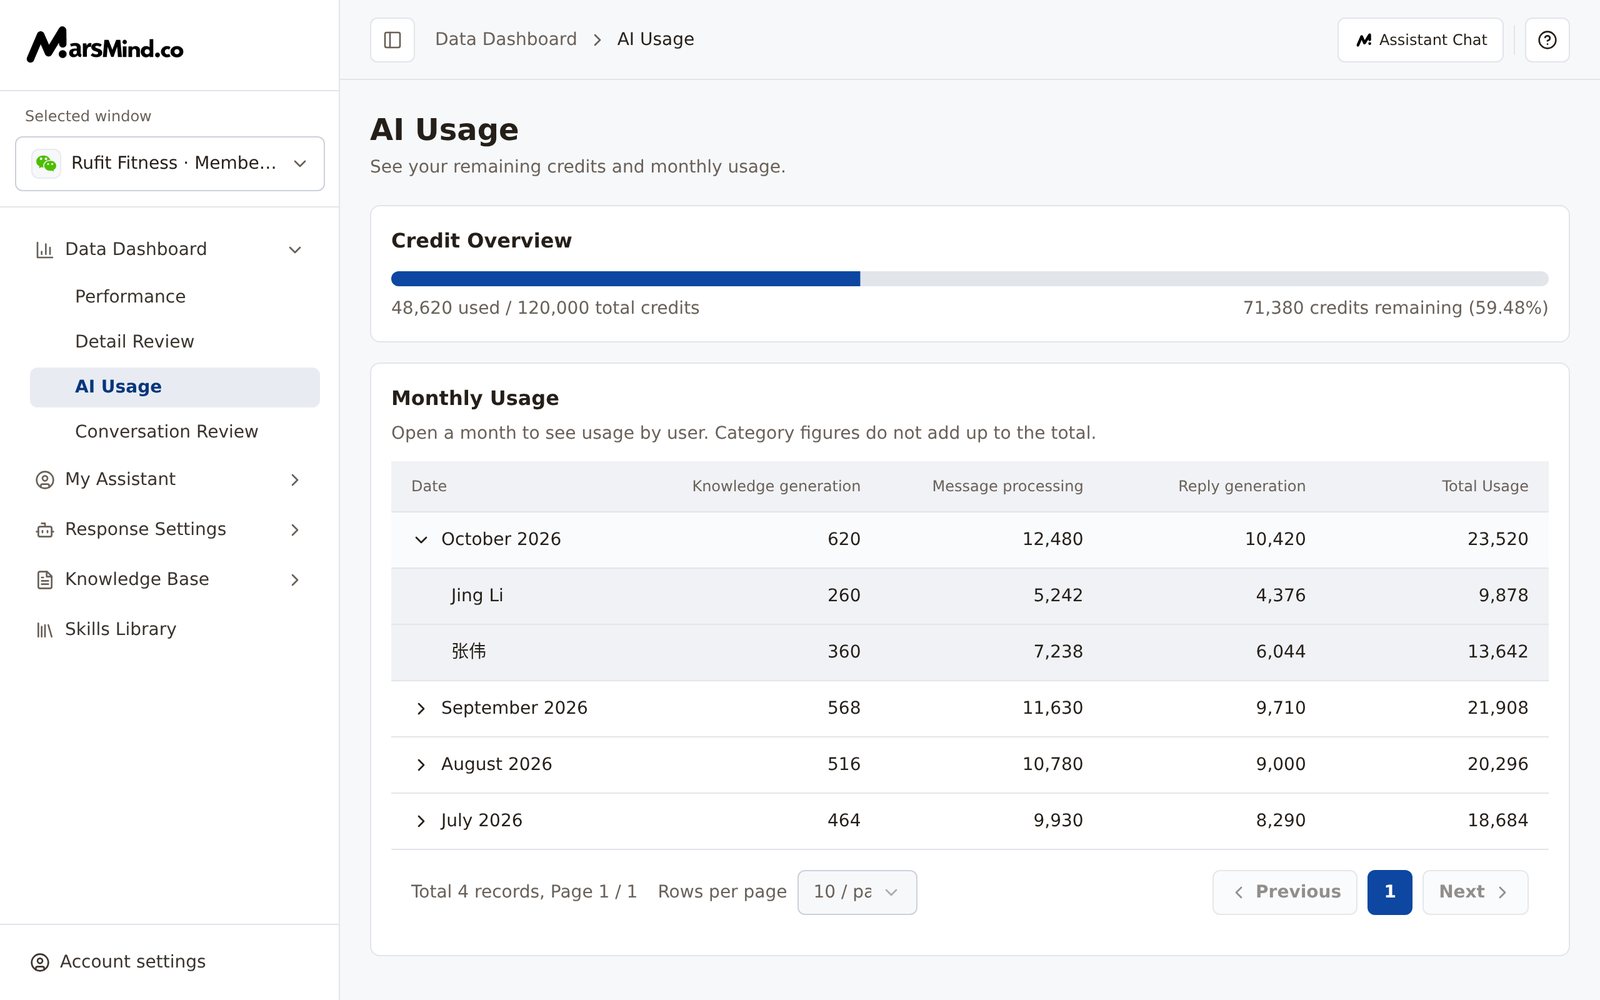
A month expanded in Monthly Usage, with per-user usage rows below it and the same columns as above

Checkpoints

  • In Credit Overview you can read the used, total, and remaining figures; the progress bar matches the used share (it shows full when over the limit).
  • Monthly Usage contains the target month, and you can read all four columns: Knowledge generation, Message processing, Reply generation, and Total Usage.
  • Clicking a month expands its user details, and clicking again collapses them.
  • When over the limit, the card title reads “Usage · Over limit” and the Extra Usage figure is visible.

Important notes

AI Usage is visible to department admins only. Non-admin accounts have no entry in the left menu, and opening the page URL directly is blocked: the page shows “Access denied” plus “This account is not a department admin and cannot view usage. Return to the dashboard or ask an admin for access.” If you need to view it, ask an admin to grant access.
When over the limit, the progress bar stops at full; the actual overage is the Extra Usage figure (“N Credits”).
When there are many months, set Rows per page to “50 / page”. Months you have expanded stay open for the current browsing session, so you can compare back and forth without waiting again (changing Rows per page collapses the expanded months, but their data is cached, so re-expanding is instant). To see how well the AI is receiving customers, compare message and reply volumes in Performance.

Frequently asked questions

The three categories do not add up to Total Usage — is the data wrong?

No. The Monthly Usage card says “Category figures do not add up to the total”; Total Usage is counted independently. For reconciliation and reporting, always use the Total Usage column and do not add the three categories yourself.

What does the page show after used credits exceed the total?

The card title changes from Credit Overview to “Usage · Over limit”, the progress bar stops at full, and an extra row shows the Extra Usage figure (“N Credits”), where N is the amount over the total.

What should I do when the page shows “Load failed”?

When loading fails, Credit Overview and Monthly Usage show “Load failed” and do not give usable numbers; click Retry on the message bar first, then reconcile once the data returns. If the failure is inside an expanded month, the expanded area also has a Retry button.

Where are earlier months?

The table shows 10 rows per page by default, with the most recent month at the top; earlier months appear on the following pages.